
 Oregon DOT, Flickr, CC BY 2.0
Snowy regions contain the majority of U.S. roads and most of the nation’s population. Monitoring how efficiently these roadways are cleared and maintained in winter can help state departments of transportation (DOTs) better manage resources while improving safety and public transparency. Performance measures vary widely across or within agencies, however, making it difficult to compare or implement effective practices.
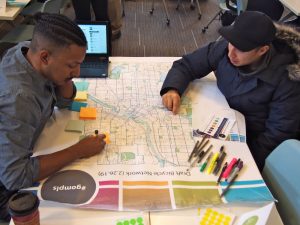
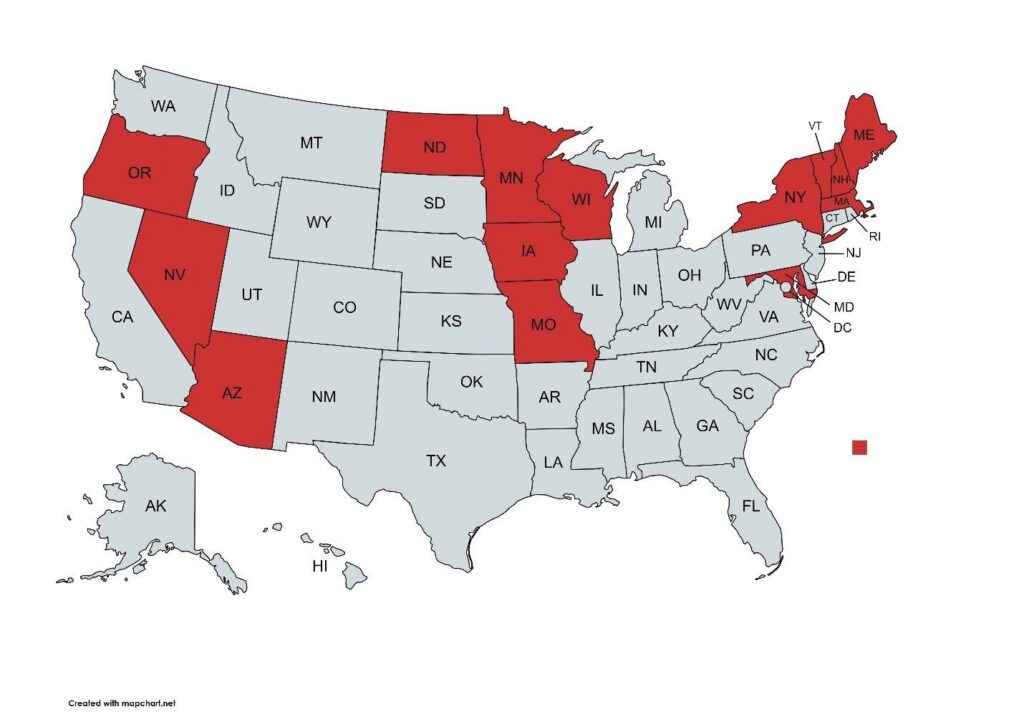
In a National Cooperative Highway Research Program (NCHRP) Implementation Support Program project that ran from 2022 to 2024, representatives from 14 state DOTs participated in workshops to advance their agency’s ability to measure snow- and ice-control performance (Figure 1). They identified and customized metrics by focusing on gaps in performance measurement and current data-collection capabilities.
Problem
State DOTs use performance measures for snow and ice control to assess how well winter storm responses accomplished agency goals: for example, clearing roads to bare, wet pavement as soon as possible to maintain mobility and safety. The impact of winter storms varies widely, depending on their time, location, and severity, which complicates the creation and use of these measures. Agency approaches to managing winter events also differ greatly, based on their budgets and operational objectives.
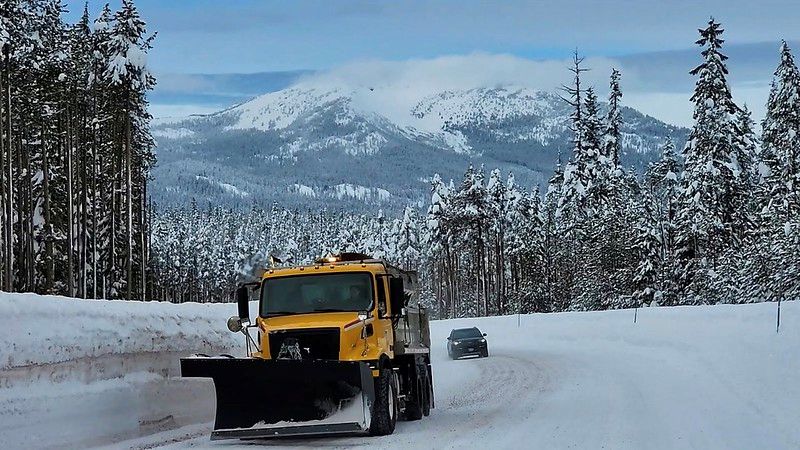
A snowplow clears the shoulder on westbound US-26 between Portland, Oregon, and the coast. State transportation agencies use measures such as how long it takes to see bare pavement or restore travel speeds to assess and improve winter road-maintenance operations. (Oregon DOT, Flickr, CC BY 2.0)
Solution
The goal of NCHRP Project 20-44(37), “Workshops on Performance Measures in Snow and Ice Control Operations Implementation” was to create and enable the use of a set of practical, effective performance measures for describing and managing an agency’s snow and ice control activities. The workshops built on NCHRP Research Report 889: Performance Measures in Snow and Ice Control Operations, which identified metrics to help assess performance toward accomplishing agency goals for winter storm responses.
The objective of NCHRP Project 20-44(37) was to help state DOTs improve their snow and ice performance measurement capabilities and customize measures identified in NCHRP Research Report 889 by focusing on their current gaps in performance measurement and data-collection capabilities. The collaborative effort included two sets of two workshops conducted before and after the winter season, for a total of four workshops.
The following areas resonated the most with workshop participants:
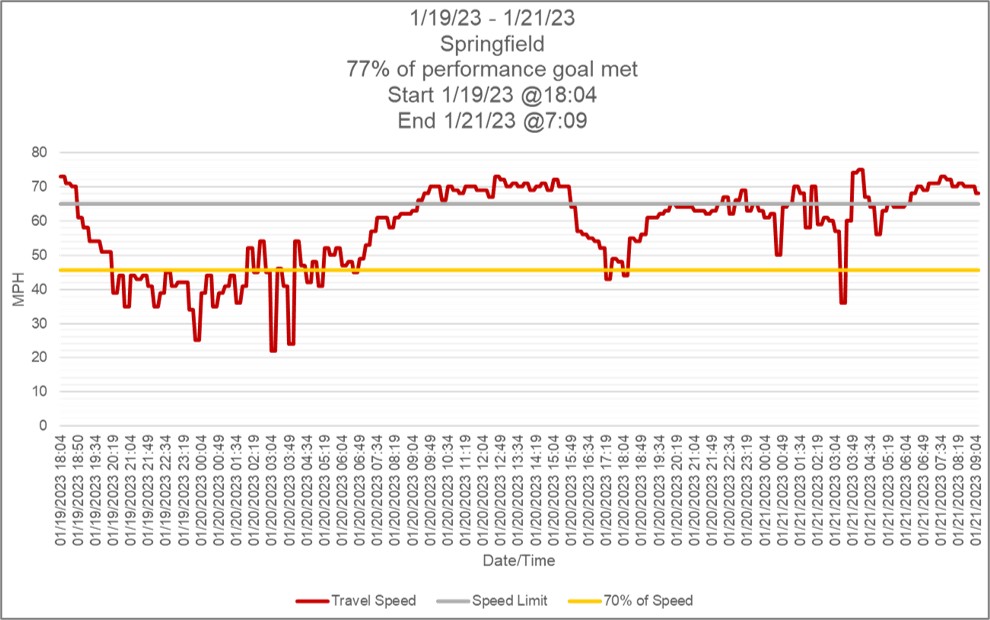
- Recovery. All participating agencies considered recovery (i.e., the time it takes for the roads to return to an acceptable pre-storm condition) to be critical but acknowledged the challenge of identifying a common measure. New Hampshire’s 70–70 measure—a performance target of having 70 percent of roadways recover to 70 percent of posted speeds within two hours—gained traction as a meaningful, clear, and realistic performance measure (Figure 2).
- Actual and Anticipated Use of Materials. A variety of agency measures focused on material usage. Massachusetts DOT, for example, uses winter severity to predict expected salt use and understand how the agency is doing with its actual salt use. Similarly, Minnesota and North Dakota DOTs actively promote the use of liquid materials, so a liquid-to-salt ratio to measure usage was important and beneficial (Figure 3). By looking at a liquid-to-salt ratio, for instance, North Dakota was able to support more investment in agency brine-making equipment and storage facilities.
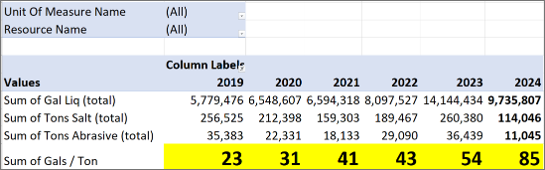
- Weather Effects. Several agencies conducted work to better understand the effects of winter storms. Missouri DOT developed a winter severity index application that relates the cost impacts of a weather event on safety, mobility, and recovery. Iowa DOT developed a new measure to provide timely information to state DOT maintenance and operations staff about the anticipated severity and consequences of storms to drive maintenance and operations responses.
- Dashboards. Many states rely on dashboards to better visualize information from performance measures on a granular level. Iowa DOT’s visualizations for winter severity supported the case for purchasing more salt. Missouri DOT created a dashboard to help visualize winter storm impact by county. Arizona, North Dakota, and Wisconsin DOTs also advanced work on snow and ice performance measurement dashboards.
Application
NCHRP Project 20-44(37) began with two in-person workshops for state DOTs within AASHTO Region 1. Participating agencies included Maine DOT, Maryland DOT State Highway Administration, Massachusetts DOT, New Hampshire DOT, New York DOT, and Vermont DOT. The first workshop helped state DOTs conceptualize and refine their snow and ice control performance measures before the 2022–2023 winter season. The second workshop—conducted after that season with the same states and the University of Albany—examined the utility and challenges with the selected measures within the full winter season.
The project also included two additional in-person workshops for eight state DOTs—Arizona, Iowa, Minnesota, Missouri, Nevada, North Dakota, Oregon, and Wisconsin—from other AASHTO regions. These workshops used the same approach and timeline as the two workshops conducted for state DOTs in AASHTO Region 1 (i.e., before and after the 2023–2024 winter season).
Benefits
Participating agencies ranged in capability. Some had decades of data and refined measurement systems, while others were just beginning to explore performance measurement. For less experienced agencies, a key lesson was that meaningful performance measurement cannot be achieved in a single year. It is a sustained process that evolves over time. Initial datasets may contain errors, and it can take multiple seasons to determine which data are most valuable and how to make decisions based on performance measures. For instance, Nevada DOT identified and corrected unusual data-reporting errors during the project. Short-term trends were often inconclusive, reinforcing the need for long-term data collection and analysis to support decision making, as well as to make compelling arguments for changes to winter maintenance practices and investments.
A central takeaway was that performance measures are not just tools for internal evaluation; they help agencies better explain what they do to decision makers and the public. Initially, participants focused on the question: “How are we doing?” Over time, this shifted to, “How can we use data to manage better and communicate more effectively within and outside our agency?” This reframing moved performance measurement from being seen as punitive to encouraging a more constructive, narrative-driven approach that recognized differences between districts and operating contexts.
This implementation effort was unique in challenging the participating agencies to do the hard work of meaningfully advancing their performance measure capabilities over the winter season bookended by the workshops. Collectively working with other states helped participating agencies develop and advance their performance measurement capabilities for snow and ice control. Regular check-ins with the implementation states provided not only accountability but also a meaningful sense of shared progress between the states.