Captured on thermal imaging, a female moose safely crosses I-90 via the Resort Creek Wildlife Underpass. She is the first moose ever documented in the South Cascades and one of many kinds of animals provided safe passage by such infrastructure. The goal is to keep wildlife—and the vehicle passengers they may encounter—out of harm’s way, while still allowing access to habitat on both sides of the road. (Washington State DOT)
Uncited data are derived directly from the author in the capacity of his field research for the Washington State Department of Transportation.
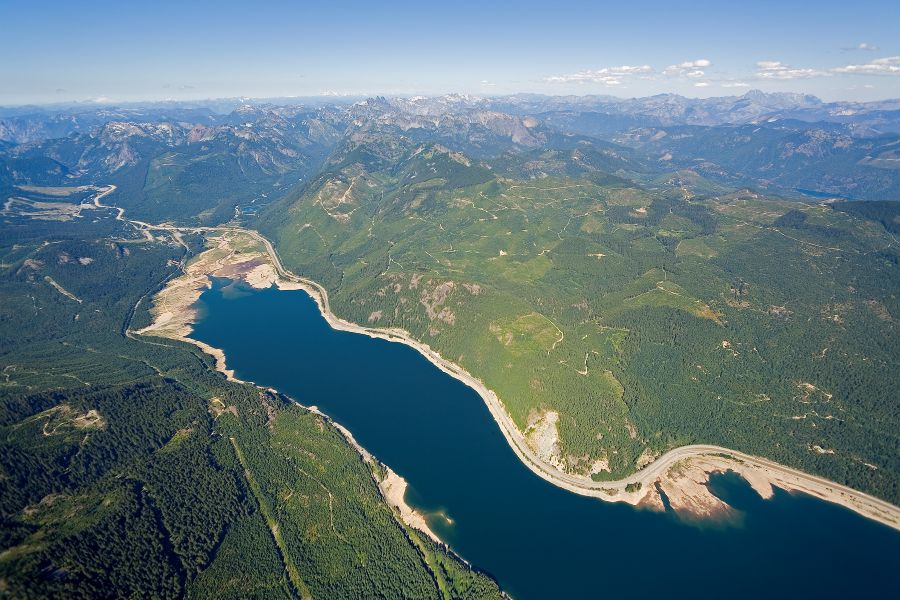
On August 13, 2022, a female moose traversing southward along the crest of the Cascade Mountains passed beneath I-90 using a safe passageway known as a wildlife crossing structure—constructed explicitly to facilitate wildlife movements across the busy highway. Without safe crossing opportunities, such as the Resort Creek Wildlife Underpass used by the moose, this highway would be a complete barrier to animal movements. Ten thousand vehicles per day is enough to form barriers to most species. However, with a significant traffic volume of approximately 33,000 vehicles per day, this stretch of I-90 that the underpass crosses far exceeds that 10,000-vehicle threshold (1).
Before 11 wildlife crossing structures were constructed on I-90 between 2012 and 2019 as part of the Washington State Department of Transportation’s (DOT’s) Snoqualmie Pass East Project, this stretch of interstate prohibited north–south wildlife movements for most, if not all, species. Hence, this moose was the first to be documented in the south Cascades. Several months later, staff at Mt. Rainier National Park documented its first moose—also a female—within park boundaries and following the same route as the pioneering cow moose.
 Seth Wimberley, Washington State DOT
Moose have slowly been expanding their range southward into Washington over the past 100 years, originally entering the state from northern boundaries with Canada and from Idaho. Historically, moose would have aborted their journey after encountering I-90, effectively ceasing their southward range expansion. However, with the advent and popularization of habitat connectivity infrastructure to aid wildlife movements, the journey is no longer cut short by the high-volume highway.
Habitat connectivity is commonly defined as the degree to which the landscape facilitates or impedes animal movements and other ecological processes. A large unbroken forest tract provides high connectivity, since animals can freely move within it. However, a forest bisected by human infrastructure, for example, typically offers little to no connectivity because it curtails access to many necessities of life, such as suitable mates, shelter, and food.
Evaluating and mitigating the impacts of infrastructure on habitat connectivity have become more common within state departments of transportation (DOTs) because roads—especially major highways—often form the most widespread and impermeable barriers to wildlife movements. Thousands of miles of highway crisscross Washington state, carrying a couple dozen to more than a quarter million vehicles per day (2). In Washington, studies indicate that cougars, mountain goats, and other species are genetically fragmented by major highways, leading to high inbreeding rates and low genetic diversity (3, 4). Over many generations, these issues can lead to declining populations and even extirpation (i.e., eradication) if individual animals cannot find unrelated mates.
When roads carve up wildlife habitat, the probability of wildlife–vehicle collisions also increases. This scenario becomes dangerous and costly for the traveling public—and is almost always fatal for the animals involved. Washington records an annual average of more than 8,000 wildlife carcass removals on state highways, with more than half involving deer species (5). Hundreds of other animals, including elk, moose, and beaver, were reported as carcass removals between 2019 and 2023.
These wildlife–vehicle collisions result in more than 100 human injuries and approximately one fatality each year. They also incur significant societal costs related to medical bills, property damage, and cleanup. One FHWA-funded study estimated that the average deer, elk, and moose collision costs $14,014, $45,445, and $82,646, respectively, without including the value of the animals themselves. Using only deer carcass removal numbers from Washington highways in 2024, with 4,350 deer carcass removals reported that year, the annual societal cost of deer–vehicle collisions was estimated to be $60,960,900 (6). This number doesn’t take into account unreported carcass removals; the true number of wildlife–vehicle collisions is thought to be at least three times as many as are reported in carcass removal data (7).
Constructing wildlife crossing structures and associated fencing in targeted areas can significantly decrease habitat fragmentation and wildlife–vehicle collisions, even offering opportunities for native species range expansions—such as witnessed with the moose dispersal. When wildlife crossing structures and wildlife fencing are deployed concurrently, they decrease wildlife–vehicle collisions by an average of 80 to 90 percent (8). Furthermore, as evidenced by thousands of safe crossings documented internationally and within Washington specifically, these structures allow unfettered access to habitat on both sides of the highway—including those carrying seemingly insurmountable traffic volumes.
Washington constructed its first two wildlife crossing structures in 1975 and today has 55 such structures on state highways. Averaging approximately one wildlife crossing structure per year over the past 50 years is significant. However, the reality is that almost 90 percent (i.e., 49 out of 55) of Washington’s wildlife crossing structures were constructed in the past 25 years, with nearly half—27 out of 55—built within the last five years.
 Washington State DOT
Incorporating wildlife crossing structures into transportation infrastructure did not become standard practice at Washington State DOT until statewide habitat connectivity priorities were established and the performance of several in-state wildlife crossing structures was monitored and reported. Prioritization frameworks provide a playbook for addressing the most important areas and facilitate collaborative efforts across agencies, partners, and jurisdictions. Monitoring provides proof of effectiveness and informs future management actions, all while incentivizing additional connectivity work in other priority areas.
Prioritization
Wildlife crossing structures are extremely effective. However, they are not cheap, easy, or quick solutions, so Washington State DOT is deliberate about where they are built. Washington State DOT and the Washington Department of Fish and Wildlife have collaborated on connectivity projects since the first wildlife crossing structures were built. They continue to work together as co-leads of the Washington Wildlife Habitat Connectivity Working Group, which focuses on developing priorities for habitat connectivity investments and implementing solutions within them. This long-term partnership culminated in the recently published Washington Habitat Connectivity Action Plan (WAHCAP).
The two-pronged approach to identifying state highway connectivity priorities described in the action plan is based on the following primary impacts that arise when roads and wildlife interact:
- Ecological: The inability of animals to move from place to place to access resources needed to survive, and
- Safety: The wildlife mortality and human safety implications associated with wildlife–vehicle collisions.
In other words, Washington State DOT’s prioritization framework identifies areas along the state highway system that would benefit most from the construction of wildlife crossing structures, whether they lead to increased habitat connectivity, decreased wildlife–vehicle collisions, or, ideally, both. This requires modeling wildlife–vehicle collision hot spots, as well as statewide wildlife corridors, and—importantly—where corridors and crossroads flank. In this approach, top priority is given to stretches of highway with the highest densities of wildlife–vehicle collisions, those that pass through wildlife corridors of the highest quality, as well as places where priorities for the Ecological and Safety categories align.
Washington State DOT does not rely on wildlife–vehicle collision data alone to identify wildlife crossing structure priorities. Wildlife–vehicle collision rates do not always rise with traffic volume in a linear fashion. Instead, when traffic volume becomes too high (i.e., 10,000 vehicles per day serving as a key threshold for many species) (1), wildlife’s primary response is to avoid the roadway because of noise and light disturbances. Without implementing a two-pronged approach that identifies wildlife corridors based on habitat and species presence (independent of wildlife–vehicle collision data), it is easy to overlook highways that may form complete and impermeable barriers to all species in the state, but do not record significant wildlife–vehicle collisions. Such locations may be more detrimental than wildlife–vehicle collision–associated mortality and should be considered priorities for mitigation. This is especially true because rare species are infrequently, if ever, reported in wildlife–vehicle collisions, but they must still navigate the highway system. Rare species such as the wolverine and Canada lynx are better served by modeling wildlife corridors rather than investigating carcass removal and wildlife–vehicle collision hot spots.
The WAHCAP resulted in the following three priority tiers, which are progressively more selective and span safety and ecological categories:
- Full Highway System Rankings divided the state highway system into one-mile-long segments and applied a numerical score to each segment using a variety of spatial data. Such data include carcass removals and wildlife–vehicle collisions on the safety side and ecosystem connectivity models, ranges, and density of Species of Greatest Conservation Need, as well as focal species models, on the ecological side. Within this tier, the top 10 percent of one-mile segment scores for the ecological and safety categories were considered high priority.
- The Long List of Transportation Priority Zones identified 157 priority locations by aggregating high ecological or safety scores using an optimized hot spot analysis to identify statistically significant clustering of data.
- The Short List of Transportation Priority Zones narrowed the Long List to 38 discrete locations using the highest average scores per zone, by category, as well as where ecological and safety priority zones overlapped.
Priorities identified within the WAHCAP framework are used for long-range and near-term planning at Washington State DOT. If a transportation project falls in or adjacent to a one-mile segment identified as high priority in the Full Highway System Rankings or any priority zone, it triggers an assessment of the project area. The assessment includes site-specific recommendations to enhance the project by improving the permeability of the highway for animal movements, reducing wildlife–vehicle collisions, or both.
Pathways to Implementation
Even though Washington built the state’s first wildlife crossing structure more than 50 years ago, there has never been dedicated funding for wildlife crossing structure planning, design, or construction. Instead, wildlife crossing structures are implemented in one of two primary ways, with a third on the horizon:
- Retrofitting existing infrastructure to benefit wildlife;
- Including wildlife crossing structures within larger transportation projects, such as widening highways or removing fish barriers; and
- Constructing wildlife crossing structures as standalone projects (soon to come).
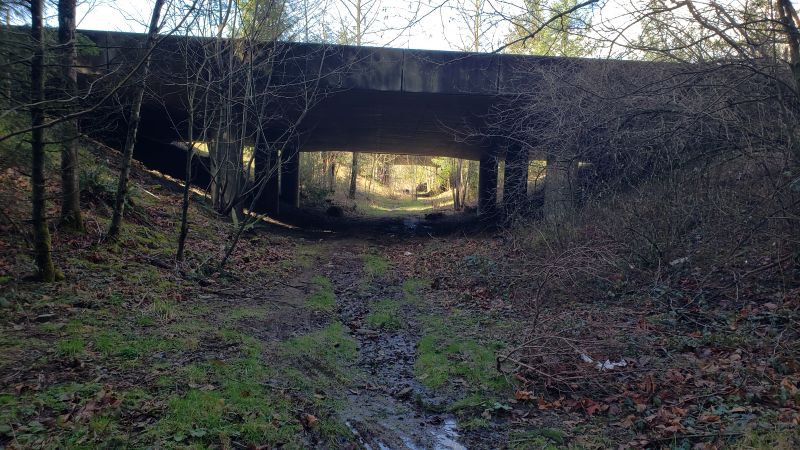
Retrofitting existing infrastructure is typically the most cost-effective method but it must be within a priority area to begin with, which can be limiting. Retrofitting involves first locating existing infrastructure within a priority area and then enhancing it in such a way that increases or allows wildlife use. Common retrofits that benefit terrestrial species include the following two examples:
- Adding wildlife fencing that leads to an existing bridge underpass that spans a watercourse or other natural substrate, or
- Installing a traversable and dry path called a wildlife bench, sometimes in conjunction with the removal of riprap.
Washington records the highest statewide wildlife–vehicle collision rate on U.S. Hwy 97, south of Tonasket. Along that route and working with Washington State DOT and the Mule Deer Foundation, which provided funding for this effort, Conservation Northwest—a state nongovernmental organization—funded the installation of wildlife fencing on the sole existing bridge underpass in the priority zone. That small investment led to significant ecological and safety improvements. Over three years, carcass removals decreased by up to 90 percent when compared with the pre-fence five-year average (9), and wildlife cameras positioned under the bridge documented thousands of mule deer crossings annually, as well as more than a dozen other species utilizing the structure to pass beneath the highway (see film below).
Every year, mule deer by the thousands—along with bobcats, cougars, wild turkeys, and California quail (listed in order of appearance)—have been recorded moving freely under the US-97 Janis Bridge Wildlife Crossing in Washington’s Okanogan Valley. A significant reduction in wildlife–vehicle collisions has also been recorded since 2019, when the crossing was retrofitted with wildlife fencing. (Washington State DOT)
Retrofits are cost-effective where they can be implemented, but most wildlife crossings in Washington came to be as elements of other transportation projects occurring in high-priority areas. Eleven large wildlife crossings were included in the completed phases of the I-90 Snoqualmie Pass East Project, which originated as a highway-widening project. Another 16 wildlife crossing structures will be included in the final two phases currently under construction. All together, these improvements include two wildlife overcrossings and more than 20 wildlife undercrossings where most were achieved by enlarging culverts and bridges at stream crossings and installing habitat features to mimic the surrounding natural environment. Including wildlife crossing structures in highway-widening projects is almost always cost-effective because the price of design, mobilization, and traffic control are typically absorbed by the larger effort that requires these elements.
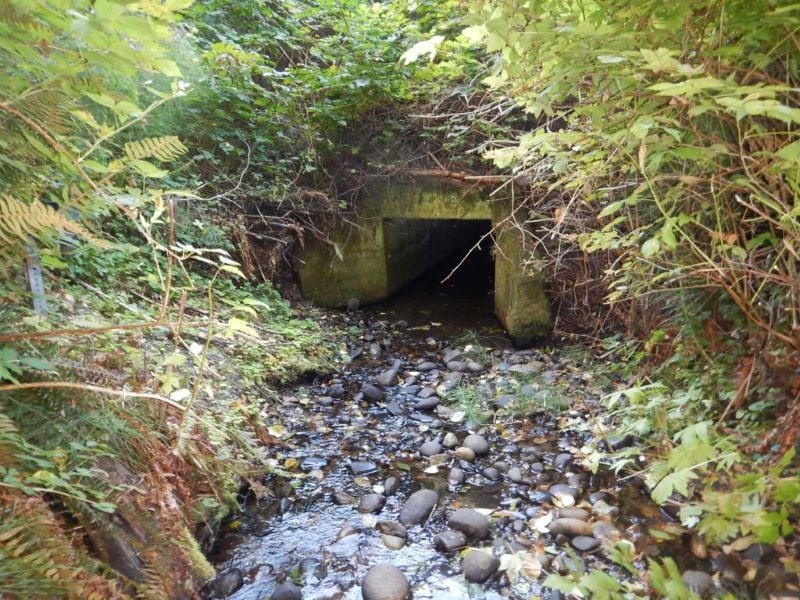
Because of the plethora of anadromous fish in Washington and the ample fish barrier removal work currently underway at Washington State DOT, there are many opportunities to align aquatic and terrestrial connectivity priorities. That results in a bounty of new fish and wildlife crossing structures. As with other transportation projects, if a fish barrier removal falls within or adjacent to a high-priority area, it is evaluated for potential enhancements that could benefit terrestrial species. These enhancements can include upsizing a structure to accommodate particular species’ needs, the addition of a wildlife bench outside the two-year flood level to provide a dry and traversable path throughout the year, or the installation of habitat features such as rock and log piles to provide cover for small and large animals.
Between 2021 and 2025, 27 fish barrier removal projects met or exceeded the minimum recommendations for terrestrial wildlife connectivity, effectively rendering them fish and wildlife crossing structures. These improvements typically required little to no added costs because—like incorporating wildlife crossing structures into highway-widening projects—most of the construction costs were necessary for other aspects of the project to be completed.
A fish barrier removal project is a wildlife crossing waiting to happen, with minor design adjustments making the difference because aquatic and terrestrial connectivity are closely related. However, providing recommendations very early in the planning and design process and ensuring they are revisited throughout the project’s lifespan are paramount to their inclusion in the final product, especially for efforts spanning multiple years.
 Damon Romero, Washington State DOT
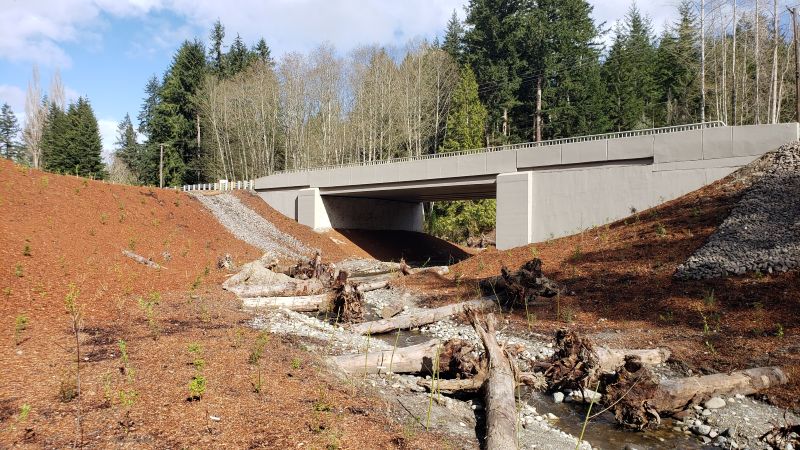 Washington State DOT
If a priority area does not contain existing infrastructure or an upcoming transportation project, the only way to facilitate a wildlife crossing structure is to plan, design, and construct one as a standalone project. This is the most expensive option because all project costs fall on the wildlife crossing structure’s budget. To date, Washington has never built a standalone wildlife crossing structure; all 55 of the state’s current structures were built during other transportation projects. If a standalone wildlife crossing structure is the only pathway to construction, outside funding is almost always required. The Stillaguamish Indian Tribe was awarded a federal grant to construct a wildlife overpass on SR-20, an elk–vehicle collision hot spot in the Skagit Valley. This project is currently in the design phase and on track to be Washington’s first standalone wildlife crossing on a state highway. Federal grants, such as FHWA’s Wildlife Crossings Pilot Program, provide a lifeline for standalone projects. However, such grants are highly competitive, limited by available funds, often only offered on a temporary basis, and still require some amount of state-level funding. Therefore, incorporating wildlife crossing structures into other projects is the most efficient and enduring implementation avenue in Washington.
Monitoring
Creating a statewide prioritization framework and constructing wildlife crossings in critical areas is a major undertaking that can span years, if not decades, but the work doesn’t end when the structure is completed. Long-term monitoring is required to document and communicate successful wildlife crossing structure projects and illustrate that investments in wildlife connectivity have paid off. This helps incentivize future actions in other priority areas.
Washington tracks the following key success metrics while monitoring wildlife crossing structures:
- The number of safe crossings compared to the number of animals that approach but choose not to use a structure, and
- The reduction in wildlife–vehicle collisions compared to pre-construction conditions.
Both success metrics are considered on a species-specific basis.
Washington State DOT attempts to monitor all recently completed wildlife crossings for a minimum of two years but strives for at least five years, as capacity allows. It can take some species years to use a new crossing structure for the first time, after which they will use it consistently. Therefore, it is important to engage in long-term monitoring to understand the full breadth of benefits.
There is a wide spectrum of monitoring intensity: from installing a single, motion-activated trail camera at a structure’s entrance and counting safe crossings to implementing comprehensive monitoring strategies that go far beyond counting large-species crossings caught on camera. The I-90 Snoqualmie Pass East Project is an example of comprehensive monitoring. If funds and capacity allow for it, all wildlife crossing projects would do well to strive for the level of monitoring implemented within this project.
The I-90 Snoqualmie Pass East monitoring effort also utilizes a combination of network-connected thermal and high-definition video cameras, remotely triggered trail cameras, and—since 2008—a research partnership with Central Washington University (CWU) to document wildlife crossing structure use for a wide range of taxa. All cameras used on the project are triggered by motion and a difference in ambient temperature. The network-connected cameras are also wired into electrical power. This allows for live viewing and automatic video uploads to Washington State DOT’s database. Such capabilities eliminate the need for site visits to collect data, as opposed to using traditional trail cameras that require batteries and store images on memory cards, which must be physically collected. As of April 1, 2026, Washington State DOT has documented—through camera monitoring—more than 37,000 safe wildlife crossings involving many species. As a result, wildlife–vehicle collisions have dropped to a consistently low level.
At sunset, a bull elk forages alone on the Keechelus Wildlife Overcrossing. (Washington State DOT)
Recently born elk calves frolic among feeding cows on the Keechelus Wildlife Overcrossing. (Washington State DOT)
[Turn up the volume.]
Atop the Keechelus Wildlife Overcrossing, a bull elk emits its iconic bugle: a mating call intended to attract a nearby group of females. (Washington State DOT)
Network-connected cameras greatly improve monitoring efficiency but require network and power connections on site, which may be implemented during larger projects such as highway-widening—if not already available. The upfront costs of trail cameras are significantly cheaper than network-connected ones. However, when considering the coverage that can be obtained by one thermal camera compared to a trail camera (and the efficiencies and cost savings allowed by eliminating the need for frequent site visits), network-connected thermal cameras are arguably more cost-effective.
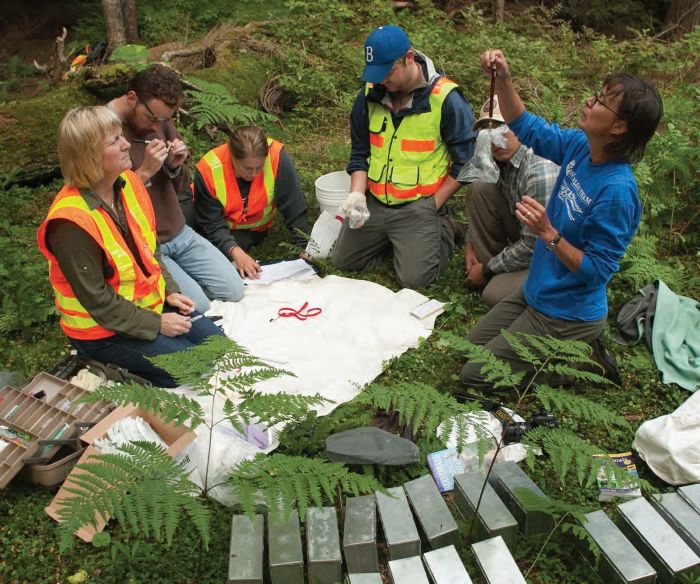
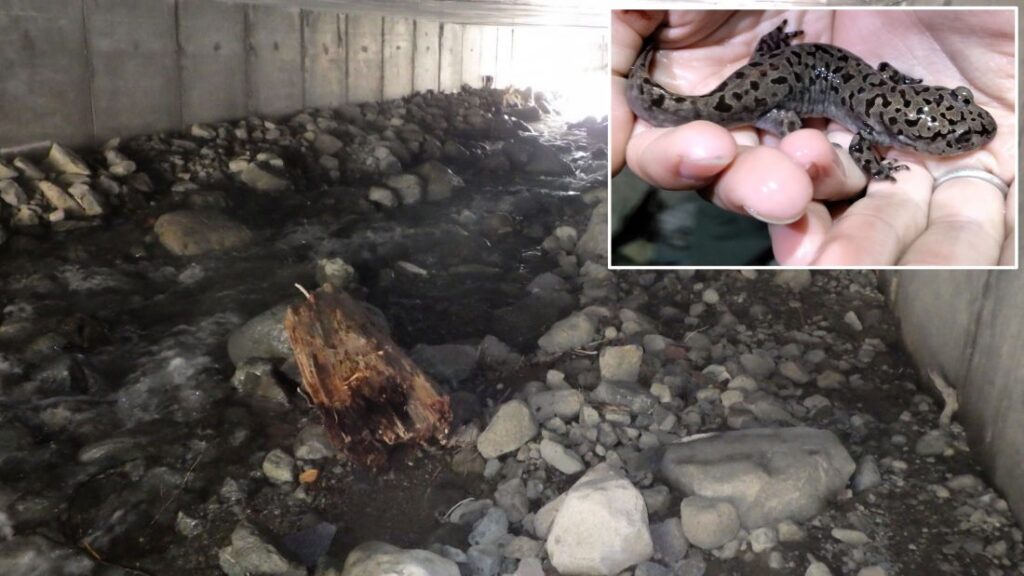
Motion-activated cameras reliably detect medium to large species from about the size of a snowshoe hare and larger, but they don’t do well with small animals or creatures that emit little body heat, such as reptiles and amphibians. To document wildlife crossing structure use by species that go undetected by motion-activated cameras, CWU conducts surveys of small mammals, reptiles, amphibians, fish, and macroinvertebrates. Using methods such as live traps, drift fences with pitfall traps, and nighttime snorkel surveys, professor and student monitoring teams have documented examples of the following:
- Coastal giant salamanders utilizing artificial streambeds within wildlife crossing structures with high site fidelity and densities similar to natural stream reaches;
- Western toads breeding in a restored wetland multiple years in a row, with tiny toadlet offspring—no bigger than a dime—emerging by the hundreds and safely crossing I-90;
- American pika using habitat features like rock piles—dubbed “pika piles”—to not only cross beneath I-90 but also live within structures; and
- Federally threatened bull trout using holding pools beneath a wildlife crossing structure.
 Washington State DOT
“The types of detections previously mentioned wouldn’t be possible with standard camera-monitoring efforts. Research partnerships, such as the one with CWU, provide a cost-effective way for Washington State DOT to meet its monitoring commitments, while the next generation of biologists, ecologists, and engineers have the opportunity to be trained in one of the coolest classrooms around. To date, more than 100 students have contributed to monitoring efforts—resulting in more than a dozen master’s theses. This truly is a win–win.”
—Glen Kalisz
 Jason Irwin, Central Washington University
As evidenced by Washington-specific and external projects alike, building wildlife crossings in high-priority areas provides significant benefits to wildlife populations and increases safety for the traveling public. However, long-term monitoring is needed to illustrate and communicate these benefits, as well as to promote the addition of wildlife infrastructure on other transportation projects in high-priority areas.
Acknowledgments
The author extends sincere gratitude to Washington State DOT’s Maintenance staff, whose removal and reporting of thousands of wildlife carcasses each year provide essential data that guide investment in safer highways—including wildlife crossings.
Appreciation is also given to the Washington Department of Fish and Wildlife for decades of collaboration with Washington State DOT, a partnership that continues to advance a safer and more efficient highway system for people and wildlife.
The author further recognizes the many agencies, Tribes, nonprofit organizations, and individuals who contributed to the Washington Habitat Connectivity Action Plan.
The author also acknowledges the Snoqualmie Pass East Project team, whose exemplary commitment to integrating habitat connectivity elements into the I‑90 project has spanned decades. This includes—but is not limited to—Brian White, Regional Administrator for Washington State DOT’s South Central Region and former project engineer, whose leadership underscored the project’s and, by extension, habitat connectivity’s significance within Washington State DOT; Mark Norman, Washington State DOT South Central Region Biology Manager, whose more than 20 years of work have been central to the project’s success; consultant Josh Zylstra, who manages, analyzes, and summarizes wildlife camera monitoring efforts; Central Washington University staff and students who have documented fish, reptile, amphibian, small mammal, and macroinvertebrate use of the crossings since 2008; and Patty Garvey‑Darda of the U.S. Forest Service, the project’s earliest and most persistent champion for more than 30 years, without whom the project would not have become a reality.
Last, but not least, the author thanks the Washington State DOT Habitat Connectivity team for the significant field work, data entry and analysis, and support provided for these and many other projects. The team includes Marisa Pushee, Assistant Habitat Connectivity Biologist; Erika Whitney, Fish Passage and Wildlife Biologist; Alannah Mitchell and Sylvia Leeb-Haigh, Habitat Connectivity interns, as well as all previous interns and staff who have contributed to habitat connectivity project—including the I-90 Snoqualmie Pass East Project.


