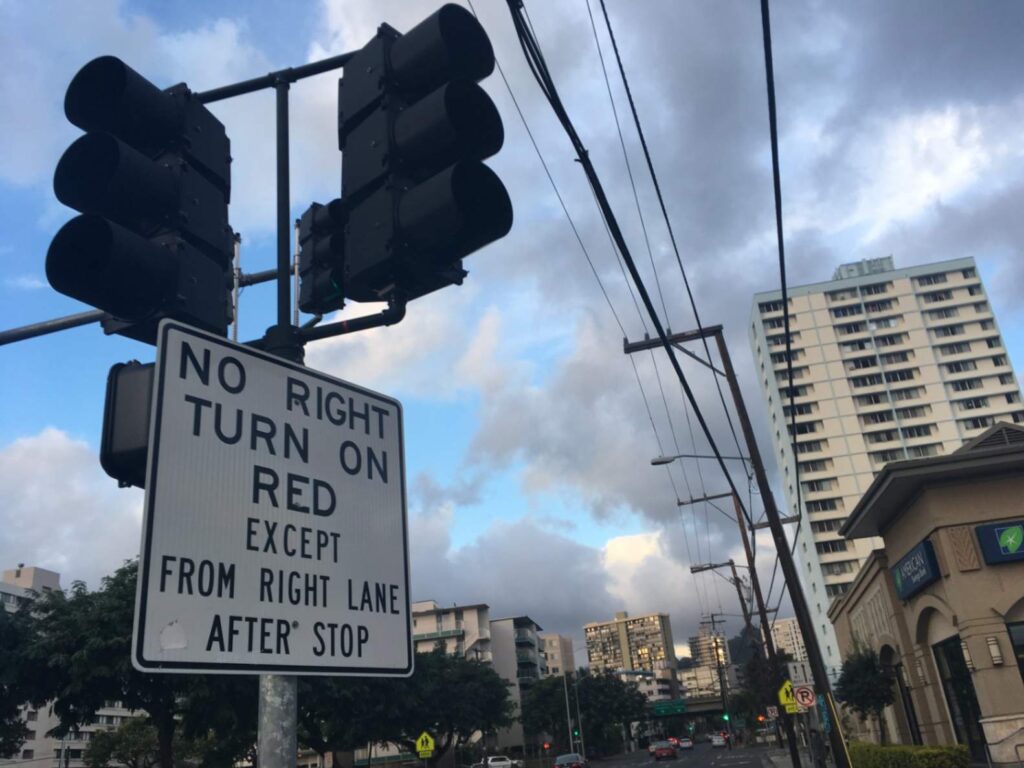
 Erica Fischer, Flickr, CC BY 2.0
Half a century ago, the Organization of the Petroleum Exporting Countries (OPEC) launched an oil embargo on the United States and other countries that had supported Israel in the 1973 Arab–Israeli War. The resulting spike in energy prices—and shortages at the gas pump—prompted the national adoption of several measures intended to reduce fuel consumption, including legalizing right turns on red (RTOR) at most intersections. Thus, a traffic control technique that had been used mainly in a few western U.S. cities became an enduring part of nationwide traffic engineering practice. The sole exception is New York City, where RTOR has remained prohibited because of pedestrian safety concerns.
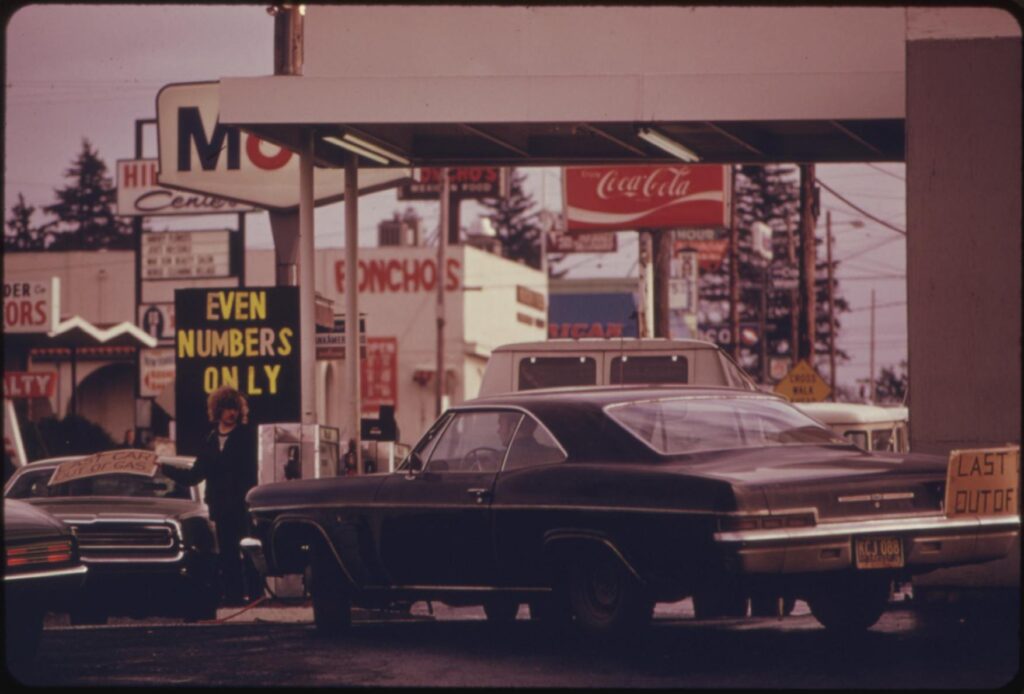 David Falconer
Although some of the fuel-saving measures adopted in the 1970s were unpopular, such as the 55 mile-per-hour speed limit, RTOR was well accepted by motorists. Today, most transportation agencies and practitioners in the United States treat RTOR as the default configuration, with site-specific prohibitions marked through No Turn On Red (NTOR) signage when necessary.
One consequence of the hasty nationwide adoption of RTOR is that neither its effects on roadway traffic capacity (i.e., the highest sustainable flow of vehicles a road can reasonably handle) nor the criteria for site-specific RTOR bans were clarified prior to the policy switch. Instead, a rough procedure for handling RTOR was added to TRB’s Highway Capacity Manual (HCM), along with a few examples of situations where RTOR was deemed inappropriate.
When analyzing intersection capacity, the HCM currently suggests subtracting the observed RTOR volume from right-turn demand, but that is rather impractical. For existing intersections, labor-intensive, site-specific observation is usually required to determine how many vehicles can complete their turns on red. To analyze future conditions, it is necessary to make assumptions about how the RTOR percentage might change over time. As traffic intensifies, there are usually fewer RTOR opportunities. New road developments and major reconfigurations are even more troublesome, since the intersection to be analyzed often does not yet exist. To compensate for the lack of clear-cut procedures, U.S. practitioners have resorted to various rules of thumb to estimate RTOR volumes—based on past experience or professional judgment. Sites with dual right-turn lanes pose a particular challenge because of limited research.
Recognizing the need for a more scientific approach, NCHRP oversaw a team led by Iowa State University researchers to study RTOR throughput and RTOR prohibition criteria. The research yielded several products to address practitioner needs. NCHRP Research Report 1068: Right-Turn-on-Red Site Considerations and Capacity Analysis—Practitioner’s Guide presents methods for estimating RTOR volume and RTOR capacity, as well as a site-level spreadsheet tool for applying them. Outputs from the spreadsheet can be used directly in the current HCM methodology and HCM-based software, and the team developed volume and capacity modeling equations that commercial software vendors can incorporate into their products. The report is augmented by NCHRP Web-Only Document 368: Right-Turn-on-Red Operation at Signalized Intersections with Single and Dual Right-Turn Lanes—Evaluating Performance, which contains a detailed description of models for RTOR volume and capacity.
Agency Outreach
The research team began its work by conducting a practitioner survey. They sought to understand current state agency procedures for estimating RTOR, as well as the criteria practitioners are using to determine where to prohibit RTOR.
The survey, which received 46 responses from state transportation agencies, municipalities, consultants, and other stakeholders across the country, revealed a wide range of practices. While some practitioners strictly followed HCM advice on analyzing RTOR, many had their own RTOR analysis procedures—which often were informal and undocumented. The most common RTOR volume estimation practice was the use of engineering judgment and past experience. A substantial number of respondents also reported relying on the default values provided by popular signal-timing optimization software packages. Only a minority reported obtaining RTOR data from field observations.
In part, this may reflect the fact that most of the respondent agencies recalibrate the timing of between one-fifth and one-third of their signals each year. For many agencies, staffing and budgetary constraints preclude obtaining RTOR counts each time a signal is adjusted. Thus, the need for a reliable RTOR volume estimation procedure is clear.
Criteria for Prohibiting RTOR
In the 1970s, American traffic engineering practice focused mainly on moving vehicular traffic efficiently. Today, the United States is moving toward the Safe System approach, which puts renewed emphasis on the safety of pedestrians and other vulnerable road users. From this perspective, the effect of RTOR on pedestrian safety deserves careful consideration, particularly for sites where pedestrian volumes are high—such as busy downtown crosswalks or where sight distance limitations increase the risk of vehicle–pedestrian collisions.
To develop a more complete list of locations where NTOR signage should be installed, the research team combined information gathered from more than 30 sources, including survey findings, discussions with practitioners, academic publications, and practitioner guides published by various agencies and groups. A summary of the most pertinent considerations is shown in Table 1.
TABLE 1 Summary of Considerations for Right Turn on Red Site Selection (1)
| Criterion | Description | RTOR Consideration |
|---|---|---|
| Sight distance | Adequate sight distance is required for right-turn drivers to be able to see all conflicting streams of traffic (e.g., vehicle, pedestrian, bicycle, and any other mode). | Prohibit RTOR if the right-turn movement has inadequate sight distance. |
| Complex geometry | Some intersection geometries make it difficult for right-turn drivers to judge the path of conflicting traffic, even if there is adequate sight distance. For example, intersections with more than four legs may have such issues. | Prohibit RTOR if intersection geometry would make it difficult to determine the path of potentially conflicting traffic. |
| Heavy U-turn traffic | The subject right-turn movement has a shadowed left turn that includes a large amount of U-turn traffic that would conflict with the right-turn traffic. | Prohibition of either the RTOR or the U-turn would resolve the conflict, as might the use of a blank-out NTOR sign (which lights up according to conditions), a pedestrian overlap, or both. |
| Heavy crossing-street speed | The cross street carries high-speed traffic, making it difficult for entering vehicles to attain that speed or encouraging drivers to heavily accelerate when executing the turn, potentially increasing risk to crossing pedestrians. | Consider prohibiting RTOR at crossings with high-speed major streets if there is a potential for such conflicts. |
| Driver destination after turn | Are right-turning vehicles unlikely to cross several lanes of traffic to reach a destination on the far side of the crossing street? | Prohibition of RTOR may be able to resolve such conflicts. So may the use of channelization (e.g., using paint or islands to direct vehicles into specific movements) and access management (e.g., dedicated turning lanes). |
| Bike boxes and turn queue boxes | Bike boxes and turn queue boxes for bicyclists—designated areas in front of the stop line that let cyclists pull ahead of motor vehicles during a red signal—occupy the intersection space needed for the RTOR movement. | Consider prohibiting RTOR if the right-turn path goes through such areas. |
| Transit and curb activities | Roadside areas and uses such as transit facilities, rideshare facilities, or other loading or unloading areas may induce additional conflicts from the vehicles participating in these activities or from pedestrians and other modes involved. | Consider prohibiting RTOR if the right-turn path would interfere with transit or other curbside activities. |
| Special pedestrian phases | Exclusive pedestrian phases and leading pedestrian intervals (e.g., traffic signals that stop all traffic or give pedestrians a head start) are intended to improve pedestrian safety. During such intervals, conflicting vehicle traffic is reduced, so RTOR vehicles may be encouraged to execute the turn but could conflict with the pedestrians. | RTOR would typically be prohibited with the use of exclusive pedestrian phasing or leading pedestrian intervals. Use of blank-out NTOR signs could resolve this situation for locations with dynamic conditions. |
| Vulnerable pedestrians | The site is used by vulnerable pedestrian groups, such as school children, older adults, and people with disabilities. | Consider prohibiting RTOR at locations with vulnerable pedestrians. |
| Large numbers of pedestrians | The site is used by large numbers of pedestrians at times, especially if there is no special treatment for pedestrians. | Consider prohibiting RTOR at locations with large numbers of pedestrians. |
| Historical performance | The site has a history of conflicts and crashes involving RTOR vehicles or generates many public complaints about vehicles failing to yield. | Consider prohibiting RTOR at locations exhibiting a record of problems related to RTOR. |
Field Data Collection
To obtain the data needed for RTOR volume and capacity modeling, the research team initially planned to record videos at numerous intersections across the United States and then use the videos to measure RTOR throughput. Just as field-data collection was scheduled to begin, however, the COVID-19 crisis abruptly upended the team’s plan. Travel restrictions suppressed traffic volumes, and at many sites the percentage of vehicles that could complete right turns during the red signal phase increased because of reductions in conflicting traffic.
As the pandemic continued, the team became increasingly doubtful that useful field data could be obtained through new video recordings and, therefore, adjusted the approach. Instead of relying solely on new videos, the team reached out to transportation agencies and consultants to obtain previously recorded videos documenting RTOR behavior. This process yielded RTOR video recordings from 219 turning-movement count studies completed before the start of the COVID-19 crisis. This enabled the research team to limit new data collection to 41 intersections with site conditions underrepresented in the archived videos, such as those with dual right-turn lanes.
In all, the team was able to obtain data from 260 intersections across 25 states and the District of Columbia. They included the following:
- 165 intersection approaches with a single right-turn lane,
- 68 approaches with shared through-right turn lanes, and
- 27 approaches with dual right-turn lanes.
More than 8,000 five-minute observations—derived from more than 650 hours of video—were obtained across all the sites (2).
Modeling RTOR Volume
After extracting traffic counts from the video recordings, the team applied several statistical modeling approaches to develop RTOR volume estimation models. The modeling process began with a systematic search for the most appropriate mathematical form for the models. The researchers then refined the models to ensure a good fit between the observed RTOR volumes and the model outputs. The team put special emphasis on avoiding the use of input data that would require special studies or be difficult for practitioners to obtain.
The team selected four mathematical forms (i.e., sets of equations) from among seven alternatives, with the goal of minimizing differences between modeled and observed values. The team then refined the models by manually testing various combinations of independent variables and performed extensive manual checks to ensure the reasonableness of the results.
The observations obtained in this study showed a high degree of variation in RTOR volume. The team considered several additional variables describing site conditions, but few had significant effects on the overall model. The researchers ultimately developed a set of models that favored the practical needs of HCM users over a more complex model incorporating a larger number of variables that did not improve how well the observed and predicted RTOR volumes matched.
Modeling RTOR Capacity
Developing RTOR capacity models proved to be more difficult than the RTOR volume estimation. The team encountered two main challenges. First, many of the sites observed in the field were operating well below their RTOR capacity. This was evident when the majority of right-turning vehicles arriving on red were able to complete their turns without much queuing or delay. A second difficulty was the high degree of variability in the maximum RTOR throughput observed in the site locations.
To address these challenges, the team began by considering all of the traffic movements that could affect the RTOR maneuver and the signal intervals during which these conflicts occur. RTOR movement was found to have potential interactions with several vehicular and pedestrian movements.
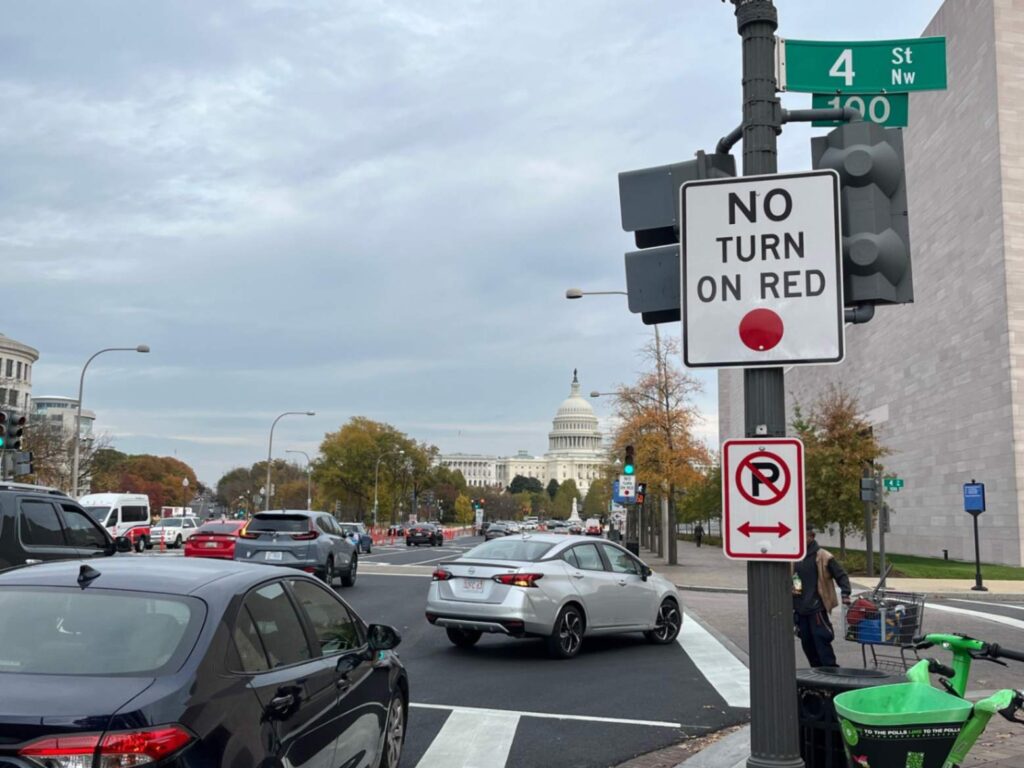 Mary Lord, TRB
The team next sought to develop new model forms through curve fitting—the process of finding a curve or mathematical function that best represents a set of data points. As the basis for this analysis, the researchers selected the existing HCM queue service-time expression (i.e., a formula for calculating the average time it takes a vehicle to move through the line at a signal). They then searched for new mathematical expressions to identify the duration of the subinterval where a gap-acceptance process—the process by which drivers decide that a perceived gap in traffic is large enough to proceed—would serve as the governing dynamic for the RTOR movement. The expressions also would approximate the relationship between capacity and the critical gap (i.e., the minimum acceptable time between vehicles in a traffic stream). In essence, RTOR movement functions similarly to two-way stop control, which only halts drivers approaching a busy intersection on the minor road. Capacity can be modeled by considering the number of sufficiently large gaps available in conflicting traffic to serve drivers turning right on red, except that this behavior occurs during certain signal intervals.
Since the number of field sites found to be operating at capacity was limited, the available field data did not cover all the operating conditions that are likely to occur in real-life practice. To address this limitation, the team augmented the field data with microsimulation analyses covering a wider range of operating conditions. Overall, the predicted models showed reasonably good performance for the single- and dual-lane scenarios.
For shared lanes, the predicted RTOR capacity was often lower than the observed RTOR capacity; this was true for the newly developed models and those previously reported by other researchers. As a result, the RTOR capacity estimates for shared lanes are likely to be somewhat conservative.
Practitioner Guide and Interactive Tools
The team’s final task was to develop a stand-alone practitioner guide summarizing the results of the research. The guide is accompanied by a spreadsheet tool that lets practitioners calculate the modeled RTOR volumes for various site configurations. The same calculations are also incorporated into the HCM Computational Engine, a set of spreadsheet-based tools maintained by TRB’s Committee on Highway Capacity and Quality of Service, allowing for a greater variety of site configurations to be modeled. The practitioner guide includes summary descriptions of the models and instructions for using the spreadsheet. In addition, it summarizes the RTOR and NTOR site-selection criteria outlined in Table 1.
Although there is much more to be learned about RTOR, the researchers hope the models and tools developed through their project will take much of the guesswork out of RTOR analysis and site selection. In addition, they are optimistic that commercial traffic-analysis software vendors will be able to make use of the computational source code and examples provided with the practitioner guide, reducing the need to transfer RTOR volume and capacity estimates manually from one tool to another. Thus, the project could optimally lead to a more consistent analysis for sites where RTOR volumes cannot readily be observed in the field and improvements in safety for vulnerable road users through more consistent prohibition of RTOR at locations where it is not appropriate.
Acknowledgments
Author Christopher Day was the principal investigator and co-authors John Shaw and Tahsin Emtenan were research team members on the project that resulted in NCHRP Research Report 1068 and NCHRP Web-Only Document 368. The authors thank team members Pat Hawley, a traffic engineering consultant for R. A. Smith and Associates in Brookfield, Wisconsin; Arya Haghighat, a research scientist at HRL Laboratories in Malibu, California; Anuj Sharma, an associate professor of civil, environmental, and construction engineering at Iowa State University in Ames; and Mark Shields, a data-collection expert at Quality Counts in Herndon, Virginia.


