 airbus777, Flickr, CC BY 2.0
For many, bicycling is an ideal mode of transport for short- and medium-distance trips that also provides health benefits. Recreational and commuter bicyclists share the space with a multitude of road users, but their appropriate place in the roadway network system has always been ambiguous. Throughout the 1970s and 1980s, traffic engineers and the vehicular cycling community vocally opposed separating bicyclists from traffic (1). Vehicular cycling theory held that bicyclists were safest when they acted and were treated as the operators of vehicles. Therefore, bicyclists should be encouraged to operate in a space shared with drivers without special accommodations (1, 2). This perspective and its resulting guidance limited the installation of separated bikeways in many communities across North America. Support for bicycling facilities to accommodate bicyclists on public roadways only started gaining widespread attention in recent decades, partly because of increasing bicyclist injuries and fatalities and subsequent concerns of bicycling advocacy groups. Bicyclist fatalities increased from 1.9 percent to 2.2 percent of total crash deaths from 2009 to 2021, despite dramatic improvements in driver and passenger safety during the same period (3).
In 2019, the National Transportation Safety Board published a report that found that 59 percent of the crashes resulting in a bicyclist fatality occur at midblock locations (Table 1), emphasizing the need for separating bicycles from motor vehicle traffic (4). As a result of this study and FHWA’s emphasis on using a Safe System approach to eliminate transportation-related injuries and deaths, interest in installing separated bicycle lanes on roadways has increased because of their safety benefits and perceived comfort (i.e., bicyclists’ feelings of safety or a reduced level of stress from traffic).
TABLE 1 U.S. Bicyclist Fatalities, Nonfatal Injuries, and Crashes by Crash Location (2016–2018)
| Locations | Fatalitiesa (%) | Estimated Nonfatal Injuriesb (%) | Estimated Injury-Only Bicycle–Motor Vehicle Crashesb (%) |
|---|---|---|---|
| At Intersections | 715 (28) | 47,648 (30) | 105,333 (66) |
| Nonintersections | 1,475 (59) | 37,235 (23) | 54,243 (34) |
| Other/Unknown | 326 (13) | 75,482 (47) | |
| Total | 2,516 (100) | 160,365 (100) | 159,576 (100) |
Note: aBased on Fatality Analysis Reporting System (FARS) data. bBased on National Automative Sampling System–General Estimates System [GES/Crash Report Sampling System (CRSS)] data. Source: FARS and GES/CRSS, NHTSA.
 Kenneth C. Zirkel, Wikimedia Commons, CC BY-SA 4.0
As a result of this interest, National Cooperative Highway Research Program (NCHRP) Research Report 1136: On-Street Bicycle Facility Design Features—A Guide and NCHRP Web-Only Document 414: Safety Evaluation of On-Street Bicycle Facility Design Features present quantitative and qualitative approaches to safety and design of bikeways.
Challenges
NCHRP Research Report 1136 and NCHRP Web-Only Document 414 provide a comprehensive review of the literature on bicyclist safety data, methods, and models, including the safety effectiveness of bikeway designs using data-driven safety analyses. The research team found significant gaps in existing literature, many of which were attributed to limited data as well as a lack of adequate study design methods. In general, lack of data is one of the major limitations in assessing the safety of nonmotorized road users (i.e., bicyclists and pedestrians). Since limited data also affect the choice and installation of appropriate design measures to improve the safety of these users, the research team spent considerable time identifying and collecting the necessary data. In doing so, they found other limitations because of inconsistencies in data-collection methods that required additional validation. For example, nonmotorized traffic volumes are not collected as consistently as they are for motorized vehicles. Moreover, different agencies use different definitions to describe the bikeway types, again limiting the development of consistent databases. Despite these challenges, the research team identified a large number of resources and data that can be used in bicycle safety studies.
Findings
Quantitative Approach
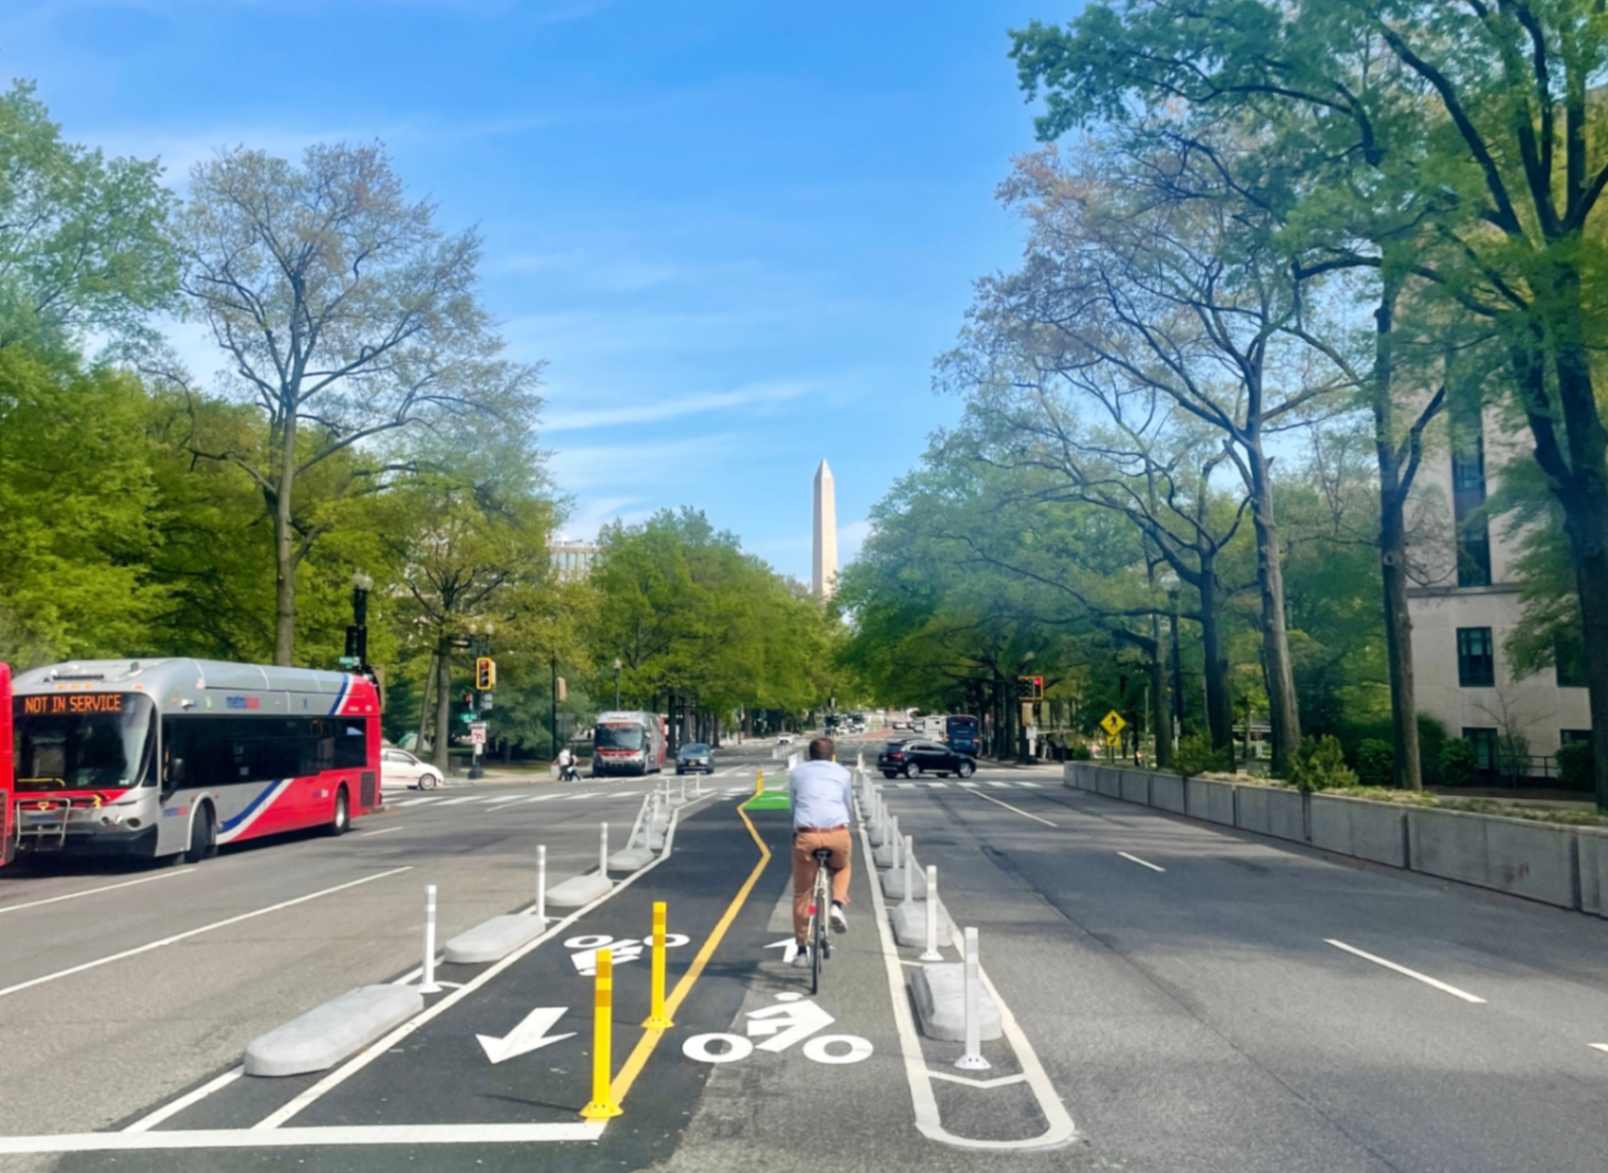
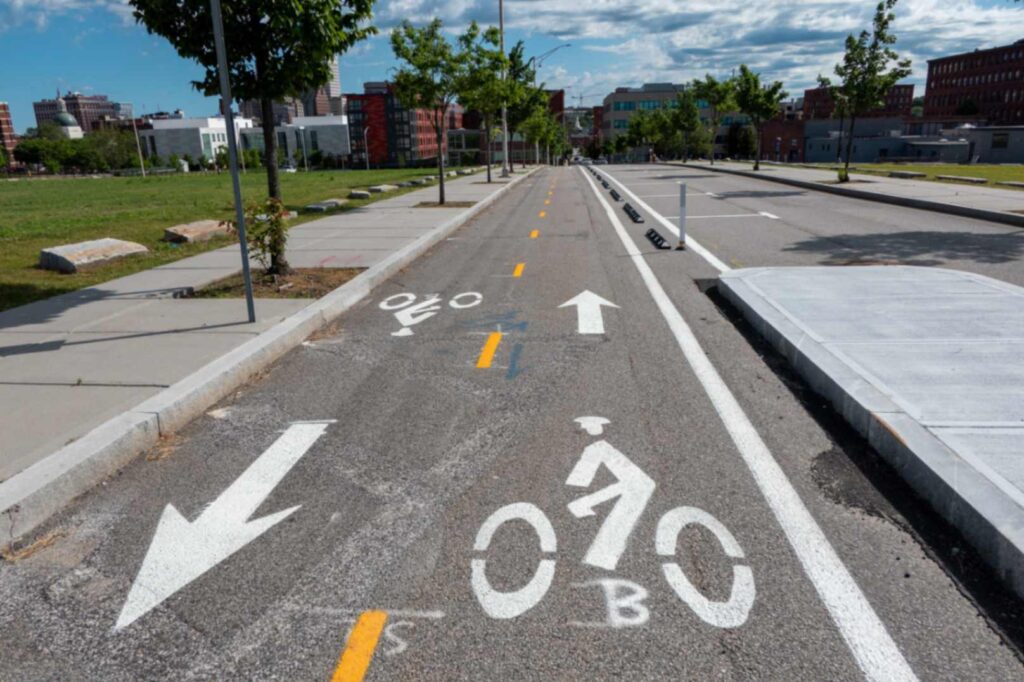
The presence of any bikeway is safer than no bikeway at a midblock section. Safety benefits vary across bikeway types, with the more advanced separated bike lanes—such as those with protective bollards—providing greater safety benefits for bicyclists than standard bikeways, such as those only made up of painted lane markers. A significant contribution of this research is the development of crash modification factors for bikeways, which addresses one of the major gaps in the literature. To come to this conclusion, the analysis used data from six cities—plus one county—in five states, which resulted in developing 27 safety models.
Qualitative Approach
Big data—extremely large datasets analyzed by computer—is not always better. Nuanced design details need an expert eye, so a qualitative assessment of certain sites was conducted to better inform practitioners and implementing agencies of contextually important design policies and practices. Assessments should consider the following:
- Modal priorities may facilitate a decision to reallocate roadway space to achieve the desired bikeway design. Alternatively, these may also inform a decision to avoid putting a bikeway on a corridor where other roadway users (e.g., transit vehicles such as buses) have higher priority.
- Access and curb space management are important factors that affect the conflicts between motorists and bicyclists. Adequate access management policies may be embedded into land use codes or ordinances to ensure that driveway access and curb space do not impact the safety of users.
- Short- versus long-term implementations. Decision makers will have to weigh potential bicycle ridership and safety trade-offs when advancing either a short-term implementation strategy or waiting for a more extensive capital project to address design challenges associated with driveways, parking, alleys, and intersection approaches.
- Maintenance of high-comfort and safe bikeways—such as separated bike lanes—has higher associated costs because of pavement markings, traffic signs, drainage, repair–replacement of vertical elements, and seasonal maintenance of the bikeway and nearby vegetation. Maintenance policies and funding levels ideally may be taken into account to support a functional bikeway network that people feel comfortable using all year.
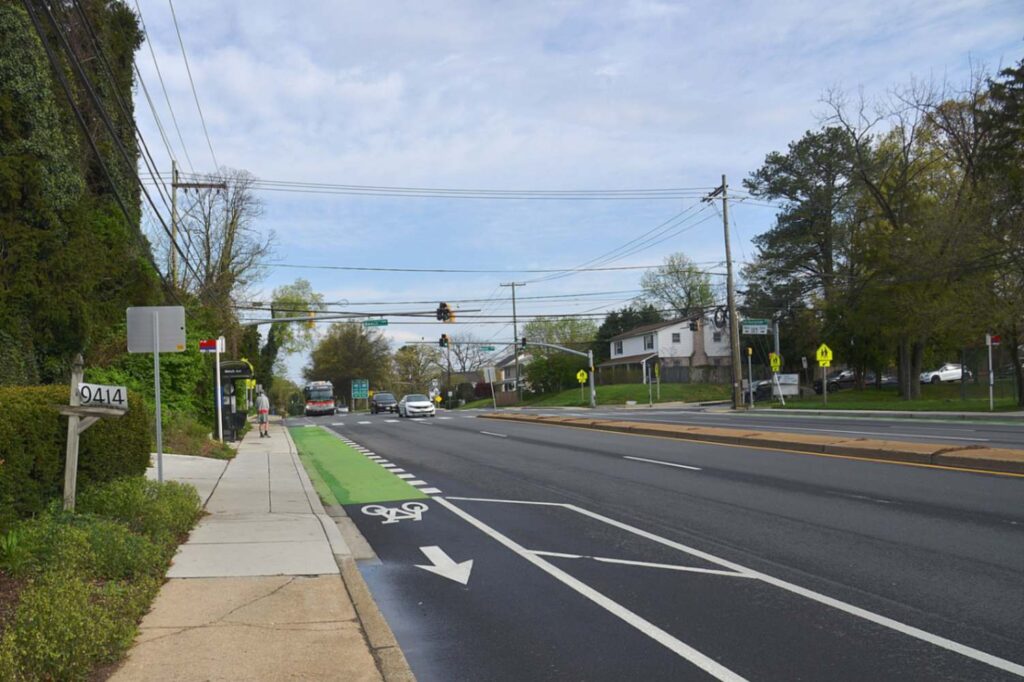 G. Edward Johnson, Wikimedia Commons, CC BY-SA 4.0
Important policy and planning considerations and decisions are suggested to achieve bicycle networks that provide safe and comfortable access to a broad spectrum of people with varying levels of bicycling experience and risk tolerance. This research does not address all of the limitations and gaps, but it provides strong context to validate the importance of design features in improving the safety of one of the most vulnerable road users. Improving bicyclists’ safety and reducing crashes can help to increase bicyclists’ safety perceptions, resulting in more people using bicycle facilities.


